Infographics are visual representations of information, data, or knowledge. They are designed to present complex information quickly and clearly. In today’s digital age, infographics have become a powerful tool to enhance content and engage audiences. Here’s why you should consider using infographics in your content strategy and how to effectively create them.
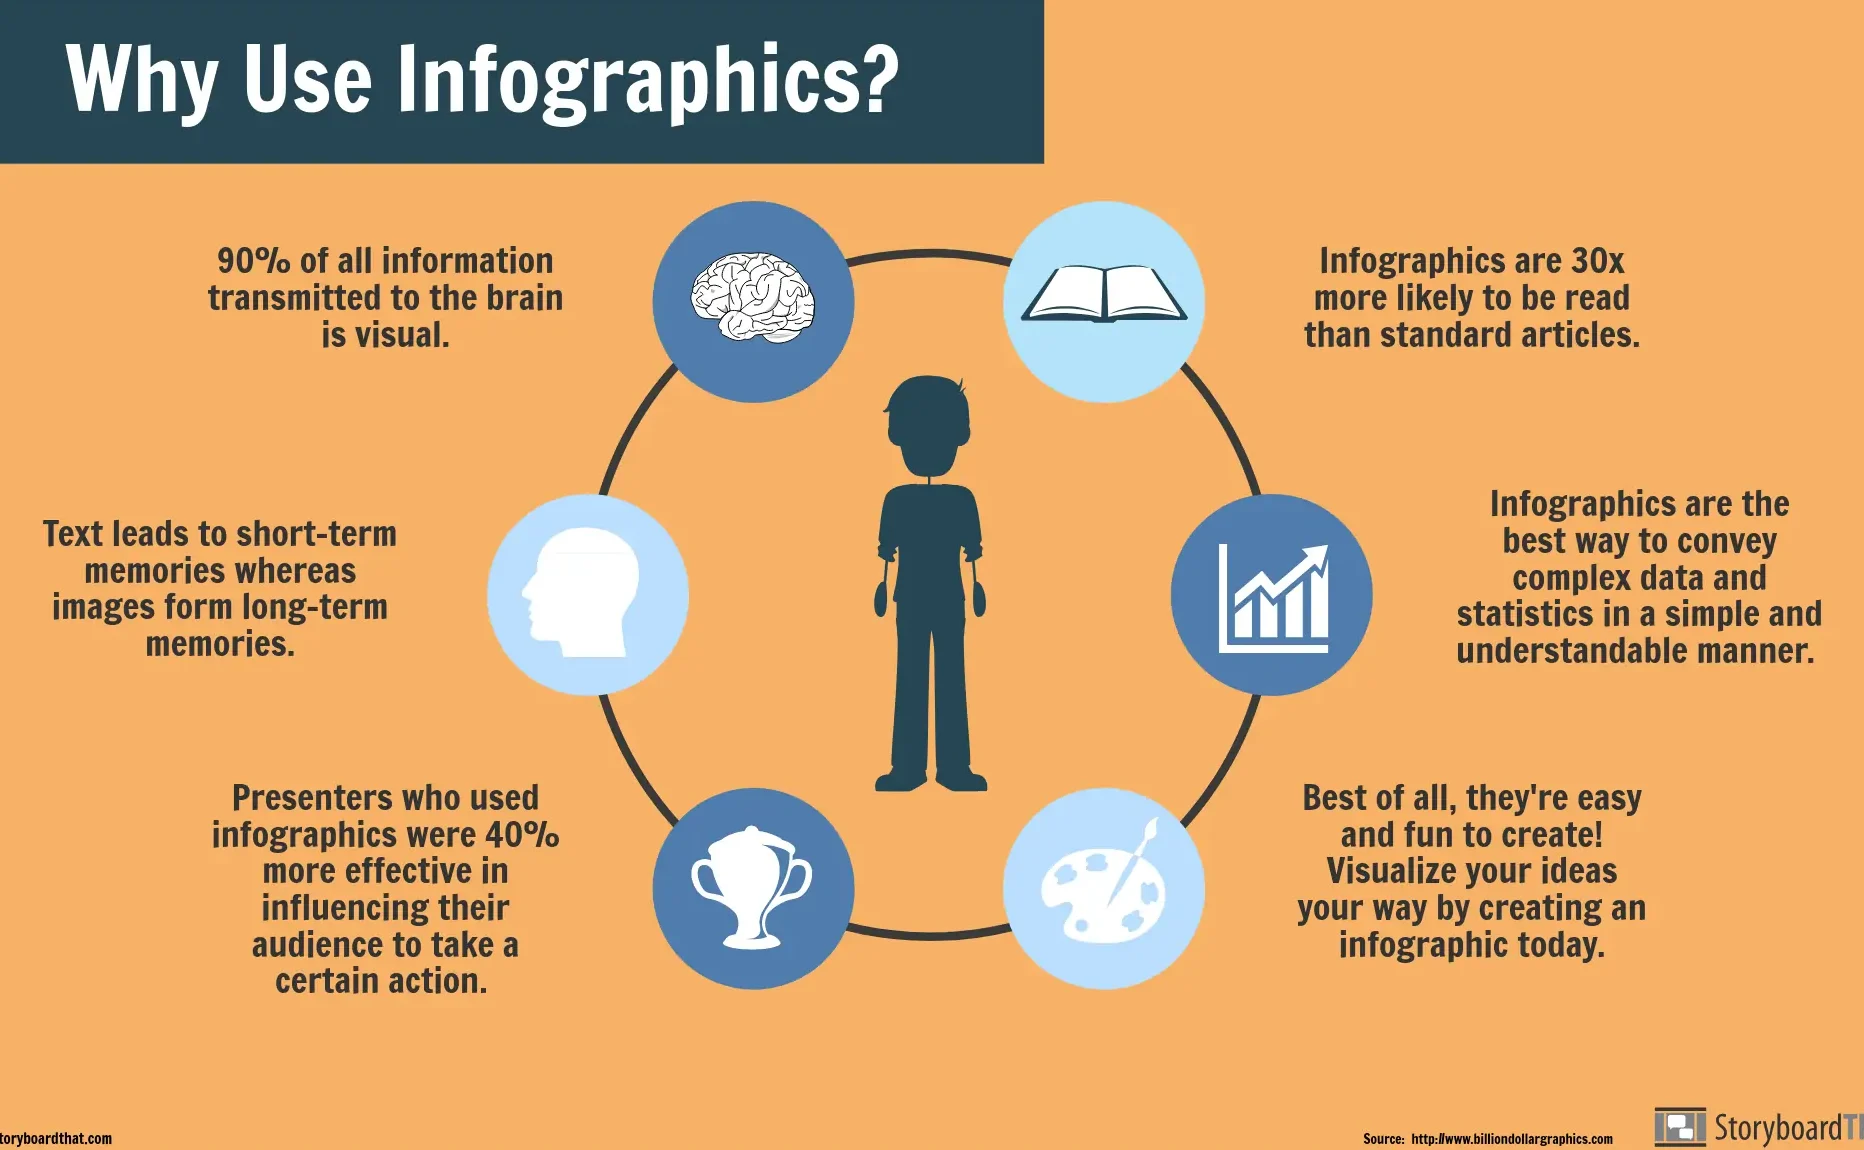
Why Use Infographics?
1. Simplify Complex Information
Infographics can break down complex data into easy-to-understand visuals. They help in presenting information in a way that is digestible and visually appealing. For example, instead of writing a lengthy article with statistics and data points, an infographic can present the same information in a concise and engaging format.
2. Increase Engagement
Visual content is more likely to be shared on social media compared to text-only content. Infographics can grab the attention of your audience and encourage them to share your content, increasing your reach and visibility. People are naturally drawn to visuals, making infographics a great way to capture and maintain attention.
3. Improve Retention
Studies have shown that people remember information better when it is presented visually. Infographics can help your audience retain the information you are trying to convey. By combining images, charts, and minimal text, infographics make the content more memorable.
4. Boost SEO
Infographics can also improve your website’s SEO. When you create high-quality infographics, other websites may link back to your content, which can boost your search engine rankings. Additionally, infographics can drive more traffic to your site as they are often more engaging and shareable than plain text articles.
How to Create Effective Infographics
1. Choose a Clear Topic
Start by selecting a topic that is relevant to your audience and can be effectively conveyed through visuals. Make sure the topic is specific and focused. Broad topics can be overwhelming and difficult to represent visually.
2. Research and Gather Data
Collect accurate and up-to-date information. Ensure your data sources are reliable. The credibility of your infographic depends on the accuracy of the data presented.
3. Plan Your Layout
Decide on the structure of your infographic. A logical flow is essential for clarity. Use headings, subheadings, and sections to organize your information. Ensure that the most important data stands out.
4. Design with Simplicity
Keep your design simple and clean. Use colors and fonts that are easy to read. Avoid cluttering your infographic with too much information. Use whitespace to give your design room to breathe.
5. Use Visual Elements
Incorporate charts, graphs, icons, and images to represent your data visually. Ensure that each visual element contributes to the overall understanding of the topic. Avoid using visuals that do not add value or could confuse the viewer.
6. Add a Call to Action
Encourage your audience to take action after viewing your infographic. This could be sharing the infographic, visiting your website, or subscribing to your newsletter. A clear call to action can help achieve your content goals.
7. Promote Your Infographic
Once your infographic is complete, share it across your social media channels, website, and email newsletters. Reach out to influencers and other websites in your industry to encourage them to share your infographic.
Infographics are a powerful tool to enhance your content and engage your audience. By simplifying complex information, increasing engagement, improving retention, and boosting SEO, infographics can significantly improve your content strategy. Remember to choose a clear topic, use reliable data, plan your layout, design with simplicity, incorporate visual elements, add a call to action, and promote your infographic. With these steps, you can create effective and impactful infographics that will resonate with your audience.